
April 2020

rain imby 1999 to 2020
November 2019 update
All measurements are related to other sensors on hand, and to other wunderground stations nearby, and to the goverment weather station at the nearby airbase.
maintainence- rgh. replaced a sensor and cables and batteries- during the year, found out website for live weather readings was not free nor available anymore. Noticed no pics of the ‘new mast’, here dey are below.
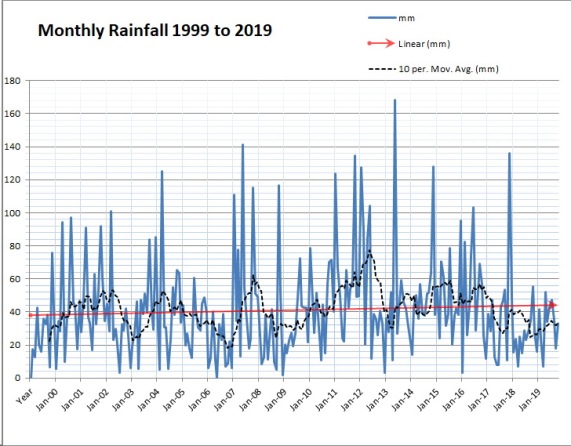
A rising trend?

 this year in the red glow track, not as bad as 2006, white track.
2012 looked to be a different year altogether, then went back to average.
2013 had a down pour in June of 158mm in one day- wowsers. Another large June downpour was in 2007,


temperature shade, newish 2011. Mast new ish 2013, many auto rain gauges (spiders), and a replacement for the conventional on the clothesline too. mast for wind above roof line,
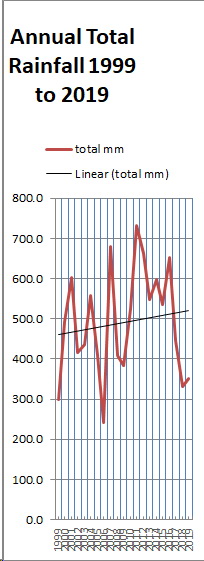

There is a rainfall rise overall since I moved to sale, in my backyard by the analysis charts.
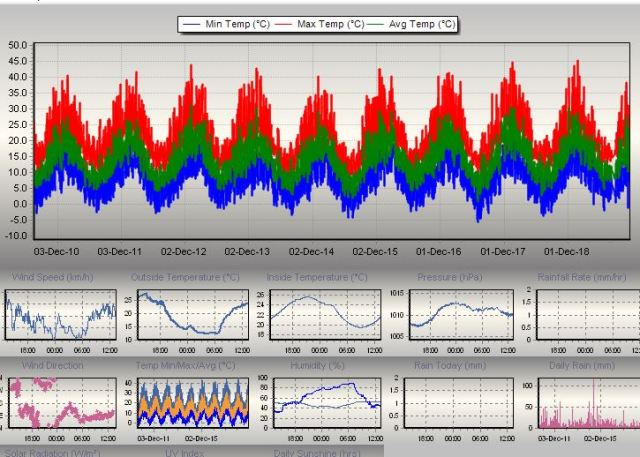
That last graph image- temperature range since late 2009- does not really show a rising overall trend. Or does it. The outside temp sensor was moved to a better shade by 2011, replaced, and there are gaps where I have been away- but overall. Hmm.
My Wunderground link [still works- Nov 2019]
September 2018 Update
A mast put up a few years ago now, 2013 actually… been lowered and raised twice for new sensors, added a bigger weather protection basket for want of a better description to house the temp/hyd/transmitter station. pics still to come… see latest blog for my backyard weather stats from the rainmeter and the weather station here.
New mast- used a 3m metal curtain pole, added 4 guy wires, and bolted the straight edge aluminium stick with wind direction and meter to top of that. rain collector nearer, on the false veranda so as to kick out little web making visitors… If sensors breakdown, a bit of a song and dance now to replace them.
Rain appears to interfere with the wind modules, but they dry out (twice now) so not too worried about those.
newUpdate coming- old mast fell down in October 2013 while I was away in the desert and the hoose keapar cood nart ferx ut! Mmph! So a new mast installed, pics to come as well as a summary 20132014 and 2015 weather in the backyard here in Sale.
February 2013-
rainfall and temperature graphs via Cumulus and the backyard gauge records up to 2013
Update 12 October 2012
This has been online, as long as my PC weather station is running.
My Wunderground link [still works- Nov 2019]
Update 28 July 2012


I finally enlarged the temperature and data transmitting station as can be seen. Going to be a bugger changing the batteries!
Weather trends last 24 hours at my joint using Cumulus as my software of choice for displaying my backyard weather data gathering and observations , and there is a worldwide web of other people using it too, like the Weather Underground network I signed up for in April– Weather Underground. There is another couple I might sign up for too, time will tell.
Rainfall record in the backyard since 1999
World class mass movements of clouds used to work
We all know the weather controls us. Face it, it just cannot be any other way. We also have to acknowledge that things change.
The Mediterranean, Port Philip Bay. These places were not there well before the Pyramids. The beaches we are so attached to, covered in that bushy vegetation we all used to run through and hide, are relatively new, they are ephemeral in the grand design of things.
Mean while we can document the evolution of our surroundings, or I want to. Hence the above sites to watch the weather.
The slide show is to show off the data collected- and you can see there appears to be a about a 3 year cycle of peaks and troughs- I have to check whether this is the Southern Oscillation or the La Nina or the El Nino effects.
To achieve more reliable wind data, I extended the mast (not in view) and now will have to guy it so it don’t snap in high winds…
25 June 2012
Had to get hold of a new Aeonometer/Windspeed Detetector as the bearings were worn to a squeaky stop after two years.
30 June 2012
notes on graphs, 2012 cummulative rainfall is showing that 2012 is pretty wet, the 15 year trend since 1999 shows on average an increase, and the drought/flooding cycle too over three or four years


You must be logged in to post a comment.